BSL Power---POWER PRODUCTS SUPPLIER
Fuel Cell Life Prediction Model: Statistical Analysis of Output Results & Accuracy Enhancement with LSTM Neural Networks
Fuel cell technology
11/26/20253 min read
Fuel cell technology is revolutionizing clean energy solutions, but durability and cost remain key barriers to widespread adoption. Data-driven prediction models—especially those powered by deep learning—offer a cost-effective way to analyze fuel cell health and forecast lifespan, reducing the need for lengthy, expensive durability tests. However, a critical challenge persists: neural network-based predictions are inherently random, leading to inconsistent output results that hinder reliability.
In this study, we address this issue by leveraging Long Short-Term Memory (LSTM) neural networks to build a fuel cell life prediction model. Through extensive statistical analysis of repeated prediction outputs, we uncover a game-changing insight: the model’s results follow a normal distribution. By averaging multiple predictions, we significantly boost the model’s accuracy and stability—providing a practical solution for the fuel cell industry.
Key Research Background
Proton Exchange Membrane Fuel Cells (PEMFCs) are highly promising for automotive and stationary power applications, but their performance degrades over time due to factors like temperature, current, voltage, and humidity. Traditional durability tests require thousands of hours of operation (e.g., 1,063 hours in our experiment) to evaluate lifespan, which is time-consuming and resource-intensive.
Neural network models (e.g., BPNN, RNN, LSTM) have emerged as efficient alternatives for lifespan prediction. Among them, LSTM neural networks stand out for their ability to avoid gradient explosion and vanishing gradient issues—common pitfalls in standard RNNs—making them ideal for capturing long-term dependencies in time-series fuel cell data. However, the randomness of neural network outputs has long plagued prediction consistency—until now.
Experiment & Methodology
1. Fuel Cell Durability Test
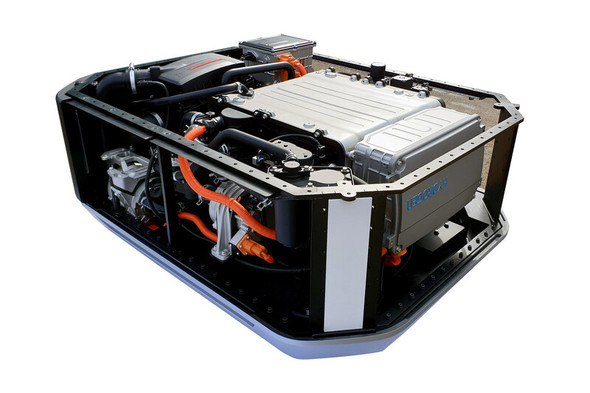
We conducted durability tests on a FCgen-1310 automotive fuel cell short stack (200 cm² active area, 6.55 kW rated power) at Tongji University. The test cycle simulated real-world driving conditions (idle, acceleration, deceleration, constant speed, and rated power operation), with each cycle lasting 1,200 seconds. Over 3,190 cycles (≈1,063 hours), we recorded 53 polarization curves to track performance degradation.
2. LSTM Prediction Model Setup
Building on prior research, we adopted a 3-layer LSTM model with the following parameters:
Parameter CategoryDetailsNumber of Neural Layers3Input Layer Neurons3Hidden Layer Neurons40Output Layer Neurons1Learning Rate0.005
We split the dataset (0–730 hours) into 70% training, 20% validation, and 10% testing. To address randomness, we ran the model 1,024 times on the same dataset and analyzed outputs across three key scenarios:
0.7 A/cm² current density at 730 hours
0.7 A/cm² current density at 820 hours
0.4 A/cm² current density at 820 hours
3. Normal Distribution Verification
To validate the output pattern, we used three standard statistical methods for normal distribution testing:
Histogram & Probability Density Function (PDF): Plotted frequency of predicted voltage values against the theoretical normal distribution curve.
Q-Q Plot: Compared quantiles of predicted data with theoretical normal distribution quantiles.
P-P Plot: Matched cumulative probabilities of predicted data to the normal distribution.
Key Findings
1. Outputs Follow Normal Distribution
All three verification methods confirmed that the LSTM model’s prediction results align with a normal distribution:
Histograms showed a "bell curve" pattern (peak frequency in the middle, tapering off to both sides).
Q-Q plot data points closely followed the theoretical normal distribution line.
P-P plot cumulative probabilities aligned with the normal distribution diagonal.
This discovery is transformative: it means the randomness in neural network outputs is not chaotic but follows a predictable statistical pattern.
2. Averaging Improves Accuracy & Stability
To mitigate randomness, we averaged 20 repeated predictions as the final output. The results showed:
Enhanced Stability: The maximum relative deviation of voltage-time curves dropped to ~2% (calculated via the relative deviation formula: \(d_{i}^{k} = \frac{\hat{n}_{i}^{k} - n_{i}}{n_{i}} \times 100\%\), where \(\hat{n}_{i}^{k}\) = k-th predicted voltage at time i, \(n_{i}\) = average voltage at time i).
Higher Prediction Accuracy: Averaging reduced output fluctuations, making predictions more consistent with real test data.
Practical Implications for the Fuel Cell Industry
This research offers actionable value for manufacturers, engineers, and researchers:
Reduced Testing Costs: Accurate, stable predictions minimize the need for prolonged durability tests.
Reliable Lifespan Forecasting: Averaging multiple LSTM outputs provides trustworthy lifespan estimates for PEMFCs.
Scalability: The method can be applied to other neural network-based prediction models, addressing randomness across clean energy technologies.
Conclusion
Neural network randomness no longer needs to be a barrier to reliable fuel cell life prediction. Our study proves that LSTM-based model outputs follow a normal distribution, and averaging repeated predictions is a simple yet effective way to boost accuracy and stability. This advancement accelerates the development of cost-effective, durable fuel cell systems—paving the way for broader adoption of clean energy.
For technical details, dataset access, or collaboration inquiries, feel free to contact our research team.
#FuelCell #LSTMNeuralNetwork #NormalDistribution #PredictionAccuracy #CleanEnergy #PEMFC #LifePrediction #DeepLearning
Published in Battery Bimonthly (Vol. 54, No. 6, 2024) | DOI: 10.19535/j.1001-1579.2024.06.003
Authors: Lu Yuanbo, Hou Yongping, Jiao Daokuan, Wang Yaojuan | Institutions: Tongji University, CATARC Motor Vehicle Inspection (Tianjin) Co., Ltd., Shanghai Motor Vehicle Testing & Certification Technology Research Center Co., Ltd.